Interpretation of Perfusion Cardiac SPECT
In different institutions, nuclear cardiology studies may be interpreted by cardiologists, radiologists, or physicians who work full time in Nuclear Medicine. The Nuclear Regulatory Commission has certain requirements for physician licensure, but these are based primarily on radiation safetl concerns, not clinical proficiency. Specific guidelines for the performance of clinical nuclear cardiology studies and for the training of interpreting physicians have been published by the American College of Cardiology, the Society of Nuclear Medicine, the American Society of Nuclear Cardiology, and the World Health Organization.
How are stress/rest myocardial perfusion tests evaluated? The pictures do not always present a clear indication of the myocardial perfusion in response to stress. The reading physician first must review raw projection data, inspecting for motion, attenuation, ventricle size, count distribution, lung activity, and subdiaphragmatic activity.
ROW TOMOGRAMS are displayed, comparing the stress images with the resting views. Defects are reported as being mild, moderate or severe; displaying reversible, fixed, or reverse redistribution. Reporting limitations is a way of working around the sticky points such as attenuation that may not be completely corrected due to high subdiaphragmatic activity or overlapping of bowel contents or liver, a low count study, lack of total cooperation on the part of the patient, or reliance upon older Gadolinium sources… are reported.
Plugging the raw projection, processed gated SPECT and row tomograms into Autoquant (Philips-ADAC) helps the reading physician to get functional data (EF), ventricular volumes, and qualitative global and regional WALL MOTION and WALL THICKENING.
Factors such as quality of stress performance, history of prior infarct or CAD, history of intervention, medicines, and presence of other disease states must also be taken into consideration. Sometimes the resting perfusion images are less homogeneous in appearance than the post-stress images, a phenomenon known as reverse redistribution.
Attention to patient history and consideration of physical limitations which may influence stress performance, careful acquisition, accurate processing, and knowledge of your vendor’s computer software programs can answer many important questions about cardiac function.
NUCLEAR PERFUSION IMAGING
A comparison between stress and resting perfusion shows us which coronary territories may be affected by impaired blood flow due to coronary artery disease. Deficient areas identified at stress
may fill in at rest to show transient myocardial ischemia. Scarred
myocardium does not take up tracer, does not contract, and negatively impacts
the total volume of blood pumped out of the left ventricle.
Processed Data Display: the Row Tomogram
The Philips-Adac system displays the processed data in the following order: SHORT AXIS, VERTICAL LONG AXIS, HORIZONTAL LONG AXIS. The SHORT AXIS slices cut the left ventricular volume from Apex-to-Base. The VERTICAL LONG AXIS cuts from the Septum-to-Lateral Wall, and the HORIZONTAL LONG AXIS cuts from Inferior-to-Anterior wall.
Characteristic appearance in the normal heart
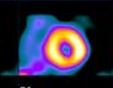
Myocardial perfusion transaxial tomography has a characteristic appearance in the normal heart. In the vertical-long axis and the horizontal-long axis slices, the left ventricle is horseshoe-shaped. The open end of the horseshoe corresponds anatomically to the aortic valve plane. The radiopharmaceutical distribution throughout the septum, anterior walls, inferior, and lateral walls of the left ventricle should appear homogeneous. The left ventricle appears doughnut-shaped in most images along the short axis plane with the central portion of the doughnut representing the left ventricular cavity. Slices through the apex show a round or oval region of activity with minimal or absent appearance of the cavity. The right ventricle may be faintly detected, and atria do not appear at all.
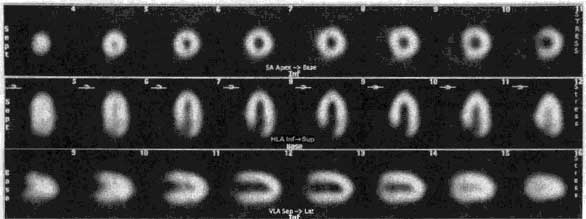 ROW 1: short axis ROW 2: horizontal long axis ROW 3: vertical long axis
In patients with myocardial infarction, regions of markedly reduced or absent perfusion are seen in areas corresponding to the location of the infarct. The extent of the perfusion defect is usually greater on emission tomography than on the standard two-dimensional scintigraphy. The border between the normally perfused myocardium and the perfusion defect is clearly defined on tomography, since perfused myocardium is not superimposed on the ischemic tissue as it is with planar imaging. Tomography improves and enhances the contrast between the myocardium and surrounding structures, such as the lungs and liver.
CORONARY TERRITORIES
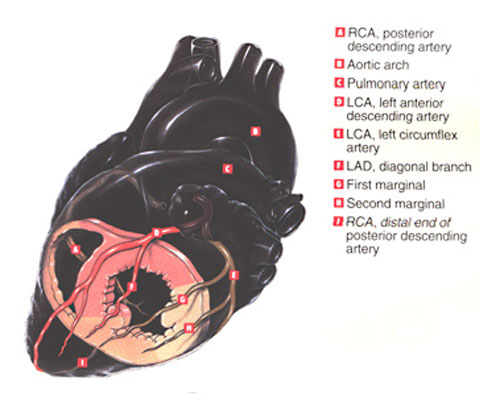
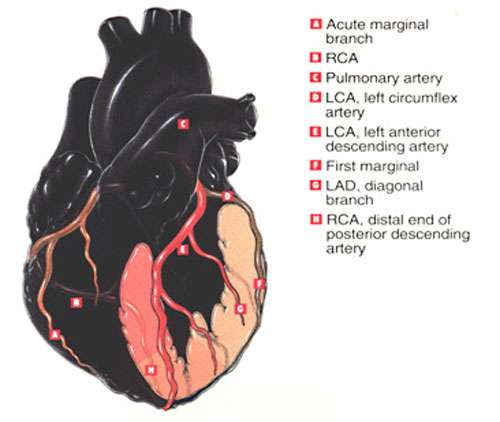
The LEFT ANTERIOR DESCENDING artery feeds 50% of the area of the left ventricle. In the thumbnails below illustrating cutaways of the coronary territories, the pink area involving septum, anterior wall and apex are perfused by the LAD.
The RIGHT CORONARY ARTERY and its branches feed the posterior wall and a small apical region, depicted in the salmon colored area.
The LEFT CIRCUMFLEX ARTERY feeds the lateral left ventricle, the region shown in pale peach.

Click on the thumbnails above to view coronary territories in more detail. Images open in a new window.
STRESS/REST MYOCARDIAL PERFUSION EXAMS: Normal Scans
Click on thumbnail images for enlarged views.
 Female Tl201 Normal
 Morbidly Obese Male
 Female Myoview Normal
 Normal Myoview, LBBB
The leftmost image of a female patient shows a Thallium perfusion exam read as normal. This is a high quality scan, with no attenuation or motion artifact.
The second exam shown is a planar Sestamibi exam on a morbidly obese male. There is significant breast and upper arm tissue contributing to attenuation artifact in this exam, however, because we gated the stress views, wall motion was completely within normal limits.
Study three is an eighty year old female patient injected midway through Adenosine stress infusion with Tetrofosmin. Left ventricular ejection fraction was calculated at over 70 percent with normal wall motion.
The last exam in this series has a photopenic septal area characteristic of Left bundle branch block, but the exam was read as normal.
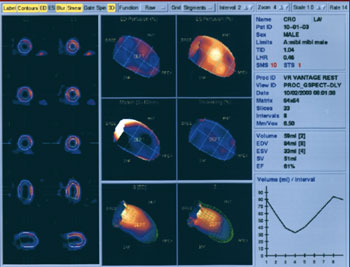
AUTOQUANT
Philips-ADAC software users appreciate a quantitation of perfusion and function software program known as Autoquant. The user may display stress/rest row tomograms, attenuation corrected row tomograms, volumetric analyses, and interactive cines for evaluation of wall motion, wall thickening, ventricular volumes, transient ischemic dilatation, lung:heart ratio, regurgitant values, polar maps, and more.
 EVALUATION OF WALL MOTION AND THICKENING
Abnormalities in regional function may add significant clinical information to the perfusion study. Gated SPECT myocardial perfusion studies are helpful in evaluating myocardial perfusion, a technique which displays the slice image as an ECG-gated cinematic study. Thus not only is the perfusion evaluated by the radiopharmaceutical concentration but diminished perfusion also is correlated with corresponding decreased myocardial wall motion and thinning associated with myocardial infarction.
DETERMINATION OF LV VOLUMES AND EJECTION FRACTION
Gaussian detection of mid-myocardial points is the basis of the most widely used software program for computing gated SPECT LV volumes and LVEF.
This program:
Operates in 3-D space and uses gated short-axis data sets; segments the LV; estimates and displays endocardial and epicardial surfaces for all gating intervals in cardiac cycle; calculates relative LV volumes; and derives global EF from end-diastolic (ED) and end-systolic (ES) volumes.
 Automatic LV identification uses initial count thresholds, separation of LV from noncardiac counts, and grouping neighboring 3-D pixels into initial estimates of structures that could be the ventricle. Initial estimates are redefined by adjusting count thresholds to remove or add pixels until a 3-D shape consistent with expected LV size, shape, and location is achieved. The best-fit ellipsoid defines a new sampling coordinate system and new count profiles fitted to asymmetric Gaussian curves. Their maxima represent the final estimate of the midmyocardial surface; the endocardial and epicardial surfaces are determined from the Gaussian standard deviation and the valve plane by fitting a plane to the most basal myocardial points. Endocardium, epicardium, and valve plane are calculated for each gating interval from an unlimited number of intervals and image matrix size.
LV cavity volumes are obtained by multiplying the individual voxel volume by the number of voxels in the space bound by the endocardium and valve plane. The largest and smallest LV cavity volumes correspond to ED and ES, from which the ejection fraction (EF) is derived. The algorithm also measures regional wall motion (WM) as the excursion of the 3-D endocardial surface from ED and ES, using a modified center line method. Segmental thickening is calculated from geometric distances between epicardium and endocardium and count considerations resulting from the apparent increase from ED and ES as a result of partial volume effects.
TRANSIENT ISCHEMIC DILATATION (TID)
The ratio between the left ventricular cavity size at stress versus rest provides a valuable marker for multivessel disease and severe ischemia in patients suspected to have coronary artery disease. While a post-stress perfusion exam may not show clearly defined ischemic defects, there may be a pronounced difference in cavity size when compared to the resting baseline perfusion. This suggests triple vessel disease which may reduce global function (reduced EF) without showing defects.
UPPER LIMITS OF NORMAL VOLUMES AND RATIOS
1. End Diastolic Volume = 120 ml (no index)
2. Transient Ischemic Dilatation (stroke volume ratios)
1.14 exercise; 1.2 adenosine; 1.25 dual isotope exercise; 1.35 dual isotope adenosine
3. Lung Heart Ratio 0.44
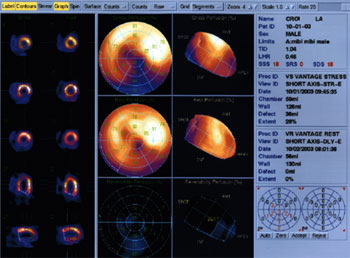
POLAR MAP AND LV SEGMENTATION
Polar maps are generated to make the comparison of global perfusion between stress and rest a little more straightforward. The polar map represents the entire left ventricular volume, separated from the rest of the heart, with the tip of the apex turned toward you in the center of the map.
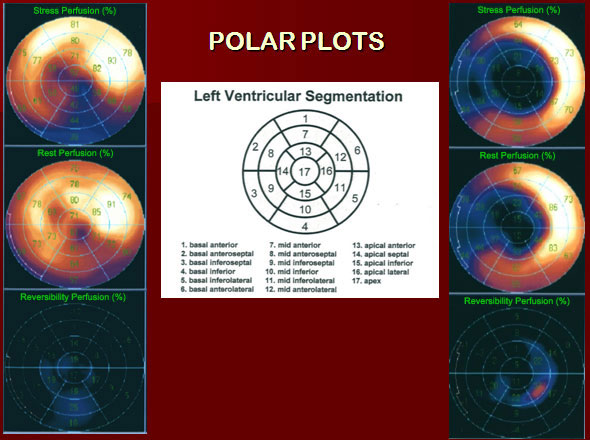
In the Polar Plot slide pictured above, polar maps of two patients are arranged vertically on either side of the segmentation guide. The top image maps show stress, the center show rest, and the bottom show the percentage of perfusion reversibility. Polar maps are divided into 17 standard LV segments corresponding to the key in the center of the slide.

If you imagine the left ventricle having a morphology similar to an orange half sliced along its equator, the map of the segments above will be easily recognized. The apical pole would correspond to the central naval of the orange. The septal wall is shared by the right and left ventricles.
Please keep in mind that any bright areas of bowel loop or gastric uptake within the plane of the LV are going to alter the intended effectiveness of the polar maps.
RISK STRATIFICATION AND PREDICTION OF PROGNOSIS
EF can be greatly diminished during exercise in a certain population of patients. Remember that in the stress perfusion test the gated SPECT is always acquired with the patient at rest, post recovery. It is possible to evaluate the actual stress EF and regional wall motion by obtaining a first-pass acquisition collected during injection at peak stress. In certain patients, temporary ischemia will show decreased function and wall motion during the exercise first pass, which may completely normalize prior to SPECT imaging. This procedure is not routinely done in nuclear cardiology labs except on special request. A dedicated multicrystal first-pass camera is used in conjunction with treadmill or bicycle exercise. A resting first pass is acquired prior to stress for comparison.
As a screening tool, myocardial perfusion imaging can be extremely useful, not only for establishing a diagnosis but also for predicting prognosis in patients with known or suspected coronary artery disease. Adding gated SPECT to the diagnostic process may provide additional information on ventricular function for further risk stratification.
This strategy may be particularly helpful and cost-efficient for establishing the cardiac status of patients with no known coronary artery disease and no evidence of cardiac valvular disease. Thus, a patient undergoing screening for coronary disease who has normal perfusion and function may not require further cardiac evaluation.
ARTIFACTS AND OTHER CONSIDERATIONS
The personnel performing the stress test, acquiring raw data, and processing the test should always strive to get the best performance from the patient and the equipment. Experienced technologists know that at times, our best efforts do not yield the highest quality end product.
Cardiac SPECT imaging results in a marked improvement in image contrast compared with planar imaging, but this improvement comes with a significant price, as artifacts in the data may be difficult to appreciate. There are certain conditions which may present challenges to the technologist and the interpreting physician, in which acquisition or filtering details must be adjusted slightly due to lower or higher count densities. Factors including large body habitus, patients with LBBB, COPD, reduced LV function, small hearts, and female patients present challenges that can be managed with proper choice of acquisition and interpretation methods, radiopharmaceuticals and stress methods. The presence of physical crystal or collimator defects, electronic instability, or inappropriate filter choices or acquisition parameters may yield images of poor visual or statistical quality.
PATIENT- RELATED ARTIFACTS: Motion , Attenuation, Extracardiac Activity
Two types of artifacts occur fairly frequently: attenuation and motion. Attenuation artifacts include breast attenuation, lateral chest wall fat attenuation, diaphragmatic attenuation, overlying and adjacent abdominal wall visceral activity. Other patient-related artifacts include upward creep and motion.
Both these artifacts tend to cause areas of decreased counts in the reconstructed data which may be mistaken for zones of decreased perfusion. These artifacts can be readily identified if the projection data are reviewed in a cinematic display. When attenuation is seen, its impact on the data can be anticipated, and the images can be interpreted correctly.
Motion, extracardiac activity near the myocardium, patients who must be imaged with arms down, patients who are claustrophobic and fear enclosure by multiple detectors may present challenges for the technologist that may require special acquisition or processing methods. Recognition of image artifact patterns from factors which may be less obvious include the presence of breast implants or prostheses, intestinal barium and self-attenuation of the inferobasal wall by the overlying ventricle.
WHAT IS ATTENUATION, AND WHY IS IT A PROBLEM?
Attenuation is the phenomenon of weakening the radiation emanating from an organ on its way to the detector. SPECT reconstruction can hide evidence of an attenuation artifact that influences a projection or set of projections in a major manner or it can magnify a relatively minor problem into a significant concern.
Attenuation by an absorber, within or outside the body, absorbs and scatters ”good photons” losing energy. The body is not uniform in density or shape. Tissue (breast, diaphragm) can block photons from exiting the body. The degree of attenuation is affected by distance and tissue density. Fewer events are detected with high attenuation.
Reconstruction algorithms ignore attenuation. Artifacts appear in images, true abnormalities are masked, and false abnormalities are reported. This results in decreased confidence, incorrect diagnoses, and reduced specificity.
COMMON ATTENUATION PROBLEMS
1. An absorber in a shirt pocket or necklace, or some other object between the heart and the detector.
2. Breast attenuation in women or men, or a dense, thick chest wall can cause subtle defects. A common feature of breast attenuation is a semicircular area of decreased activity, extending into the cardiac background. Compression of breast tissue using an elastic wrap or velcro strapping can help reduce this artifact and should be done during stress and delay (rest) imaging. Some clinics prefer to leave the breast in its normal position, stabilized with a bra, for both sets of images.
Shifting breast tissue artifact can make for a confusing row tomogram, especially in the Thallium study, where attenuation correction is not applied. The attenuation patterns may simulate reversibility, partial reversibility or reverse redistribution- this is under the control of the technologist and must be applied consistently on all female patients.
Breast artifact in SPECT is most commonly manifest as areas of decreased activity in the anteroseptal and anterolateral segments, but could affect the lateral wall, as well.
3. In men, short, or obese patients, the diaphragm may attenuate the inferior wall in the inferior and inferoseptal basal regions of SPECT slices. On Thallium scans performed on men, the addition of a left lateral decubitus view can completely eliminate attenuation by the diaphragm. Repeating the exam in the prone position may eliminate the artifact completely. Prone imaging tips the heart away from the diaphragm. Prone imaging also eliminates motion attributed to breathing.
GATED SPECT VS ATTENUATION
It is well recognized that nonhomogeneous attenuation from various organ tissues within the thorax can affect the specificity of SPECT myocardial perfusion imaging. Most physicians rely on visual interpretation and quantitative analyses to interpret these studies. They learn to integrate, in their final data analysis, the effects on the perfusion patterns of the presence of different physical factors such as variable spatial resolution of collimated SPECT systems and nonhomogeneous attenuation.
Soft tissue attenuation can create significant artifacts. Overyling breast tissue contributes to an anterior wall perfusion defect in women and men, while diaphragm creates an inferior wall defect in many male patients. Gating allows the physician to evaluate LV wall motion to determine whether the defect is real. Healthy myocardial tissue contracts well and thickens when it contracts. Wall motion in ischemic regions is slightly diminished, and scarred tissue does not contract normally.
EXTRACARDIAC ACTIVITY
When high levels of hepatic uptake or subdiaphragmatic activity of perfusion tracers are evident, lower-than-expected counts values may be recognized in the adjacent inferior myocardial wall. This phenomenon was studied in simulations and found to be the result of photon attenuation effects during reconstruction, distorting liver reconstruction and influencing inferior wall activity.
Although attenuation correction with Gd-153 transmission scans adequately eliminates breast and diaphragm artifacts, the presence of subdiaphragmatic radioactivity, especially when it is brighter than the heart, can cause uneven application of counts to the slices.
Liver activity clears with time. Offer the patient a small meal to stimulate emptying. A bright bowel loop may be cleared very quickly after drinking a large glass of water or a carbonated beverage. Carbonation rinses the tracer from the lining the small bowel loop, and drinking ice water can help stimulate peristalsis. Occasionally, we see radioactive bile refluxing up into the stomach, which generally worsens over time. When possible, ask the patient to eat a full meal and image an hour or more later.
Some proton-pump inhibitor medications prescribed for acid reflux disease or gastric ulcer may be absorbed by the lining of the stomach. An outline of the stomach will be evident on the raw projection image, and slices through this area clearly show the cavity of the stomach. This activity is trapped by the organ and, unfortunately, does not move.
- 7a: Planar Imaging
- 7b: SPECT Imaging
- 7c: SPECT Anatomy
- 7d: Interpretation
- 7e: Attenuation Correction
- Lesson 7 REVIEW