Transmission-Based Attenuation Correction for Cardiac SPECT
What is Attenuation, and Why is it a Problem?
Attenuation is the phenomenon of weakening the radiation emanating from an organ on its way to the detector. SPECT reconstruction can hide evidence of an attenuation artifact that influences a projection or set of projections in a major manner or it can magnify a relatively minor problem into a significant concern.
Attenuation by an absorber, within or outside the body, absorbs and scatters ”good photons” losing energy. The body is not uniform in density or shape. Tissue (breast, diaphragm) can block photons from exiting the body. The degree of attenuation is affected by distance and tissue density. Fewer events are detected with high attenuation.
Reconstruction algorithms ignore attenuation. Artifacts appear in images, true abnormalities are masked, and false abnormalities are reported. This results in decreased confidence, incorrect diagnoses, and reduced specificity.
This can present a problem for a variety of reasons. Artifacts may appear in images and may be mistaken for paucity of blood flow to segments of the heart wall. True abnormalities may be masked by fFalse abnormalities, making interpretation difficult if not impossible. Decreased confidence leads to incorrect diagnoses, and the industry may suffer due to perceived reduced specificity.
COMMON ATTENUATION PROBLEMS
1. An absorber in a shirt pocket or necklace, or some other object between the heart and the detector.
2. Breast attenuation in women or men, or a dense, thick chest wall can cause subtle defects. A common feature of breast attenuation is a semicircular area of decreased activity, extending into the cardiac background. Compression of breast tissue using an elastic wrap or velcro strapping can help reduce this artifact and should be done during stress and delay (rest) imaging. Some clinics prefer to leave the breast in its normal position, stabilized with a bra, for both sets of images.
Shifting breast tissue artifact can make for a confusing row tomogram, especially in the Thallium study, where attenuation correction is not applied. The attenuation patterns may simulate reversibility, partial reversibility or reverse redistribution- this is under the control of the technologist and must be applied consistently on all female patients.
Breast artifact in SPECT is most commonly manifest as areas of decreased activity in the anteroseptal and anterolateral segments, but could affect the lateral wall, as well.
3. In men, short, or obese patients, the diaphragm may attenuate the inferior wall in the inferior and inferoseptal basal regions of SPECT slices. Imaging men in the prone position will eliminate this artifact. On Thallium scans performed on men, the addition of a left lateral decubitus view can completely eliminate attenuation by the diaphragm.
ATTENUATION CORRECTION
Common methods for application of attenuation correction of SPECT acquisition data do not work well for myocardial perfusion imaging. Cardiac attenuation correction is accomplished with transmission imaging.
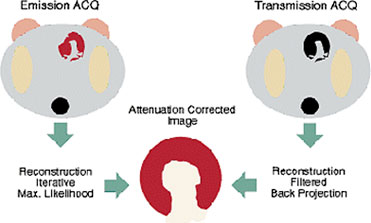
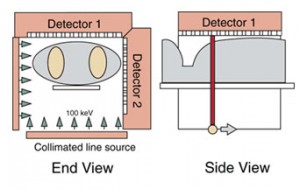
The current method of choice is a scanning line source for transmission image generation on a dual-head camera with a 90º configuration and parallel-hole collimation, applied over 180º from the RAO to the LPO. Gadolinium-153 transmission sources scan across the field of view simultaneously with the emission acquisition projecting ~100 keV photons through the patient. Electronic masking with a small window and slit collimation of the source provide energy and spatial separation from the emission photons. The transmission scan is acquired simultaneously with the emission study to estimate the nonuniform distribution of attenuating structures between the camera and myocardium.
The daily reference flood, or ‘blank’ scan, determines the total attenuation distribution in 3 dimensions and is applied to each study. The study-specific attenuation map then can be generated with iterative or back projection methods. The -EMSCR data set is generated with information added back to the emission data, erasing soft tissue attenuation.
ATTENUATION CORRECTION WITH VANTAGE
Commercial attenuation correction hardware and software improves the accuracy of myocardial perfusion imaging by minimizing the effect of tissue attenuation artifacts on the final images. In SPECT Sestamibi cardiac imaging, we apply attenuation correction with “Vantage” from Philips-Adac. Vantage consists of two collimated line sources filled with Gd-153 which move across the field of view of each detector of a multidetector gamma camera during the SPECT study. Emission and transmission projection images are obtained for each angular position. Perfusion images are then corrected for attenuation.
VANTAGE (Philips-Adac)
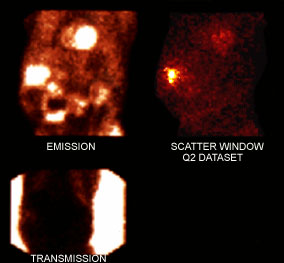
Simultaneous acquisition of transmission, emission and gated data efficiently obtains attenuation compensated and functional images. Vantage data is acquired in multiple energy format. The three energy peaks for Tc-Gd acquisition contain the Tc99m window, the scatter window, and the Gd-153 window. (Gd-153 has a t1/2 of 241 days: line sources must be changed once a year). The first acquisition contains the Raw Tc99m -Mibi “Emission” (EM) data, which may be gated or non-gated; the second data set is the Scatter Window (Q2), and the third is the Transmission scan (TR).
Vantage studies are preprocessed automatically immediately after acquisition. The raw simultaneous emission and transmission acquisitions are handled like a dual-isotope scan and must be separated into their components prior to reconstruction and reorientation. One cannot split the data without the blank reference scans and NUAC offsets and curves. The Vantage Split and Vantage Gated Split programs split the raw data and apply scatter correction. The data is then prepared for reconstruction and processing, performed by the technologist
|
|
|
|
Blank scans that are acquired every morning are added to each patient’s vantage acquisition. The reference “blanks” are used to “split” the raw multienergy datasets into separate entities. |
Emission data is the Tc99m- Myoview or Mibi scan, the Scatter window is a throwaway dataset, and the transmission map is the Gadolinium line source contribution. |
NUAC offsets and curves graph the table position. |
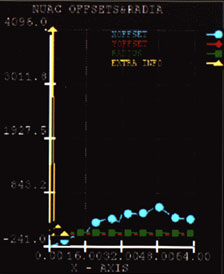
The data set designated as the NUAC offests and curves represents the position of the scan table during each exam. Observe the third slide above, where the blue dots depict the X-offset; red diamonds show the Y-offset, the green squares show the radius, and the yellow diamonds are the extra info. Being a unique dataset for each acquisition, one may never apply NUAC data from any other exam in an effort to split a raw acquisition. If your system fails to write your patient’s NUAC dataset to disk, you must repeat the acquisition.
If you have processed center of rotation (COR), the terms “ X and Y offset” will be familiar to you. These are the values of the table positions in the X and Y axes, the vertical and horizontal table positions. The radius is the detector height, or the distance of the detectors from the patient.
Scatter Correction and Resolution Recovery
Scatter is often the cause of image artifacts, most often involving augmentation of inferior wall counts as a result of scattered radiation derived from an area of intense subdiaphragmatic activity. This may obscure inferior wall defects and may make fixed defects appear reversible. Scatter radiation from adjacent hepatic or bowel activity may enhance a region in the posterior basal wall with low primary count levels as a result of regional attenuation. Correcting this scatter component for the associated attenuation results in an overcompensation of intensity that may make other areas appear falsely underperfused. To avoid this effect, we correct for scatter first, then for attenuation.
Resolution Recovery provides sharper edges to images without adding noise. The uniformity of normal myocardium is thus improved, with improved separation of the heart from sub-diaphragmatic activity.
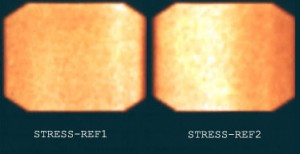
A daily blank reference scan must be acquired, checked for acceptance, and saved to the main disk. Copies of the reference scans are automatically saved to each patient’s file and are needed to split the multienergy data sets into separate components for processing. The patient’s transmission images are combined the ‘blank’ scan to estimate total attenuation through the patient. Resolution Recovery and Scatter Correction are applied to the emission data, normalized to your daily blank reference scans. The corrected emission images have the -EMSCR tag and the corrected transmission images have the -TRSC tag applied to them.
Reconstruction and Filtering Methods
In some labs the Filtered Back Projection (FBP) technique has been replaced with the Bayesian Iterative Transmission Gradient method for reconstructing the GSP and EM data sets. Attenuation map reconstruction also employs the Bayesian Iterative technique using a minimum of 12 iterations (our program uses 30), an operation which takes twice the time of the FBP technique. This technique produces more consistent attenuation maps than FBP. A Butterworth filter, a frequency cutoff of ~ 0.45 to 0.55 and an order of ~ 5.0 are a good place to start with a high-quality, 2 day acquisition. Low-dose images require more smoothing and background correction; high-dose filtering must be adjusted with a higher cutoff to prevent excessive smoothing. There is a function in the processing program that allows one the option to compare different frequencies.
By mathematically reconstructing SPECT projection data in multiple unfiltered passes or ‘iterations’, iterative reconstruction results in a higher quality reconstructed image dataset. Iterative reconstruction provides a platform which can support numerous image restoration techniques: transmission source-based (non-uniform) attenuation correction [NUAC], scatter correction, and resolution recovery [maximization of available resolution relative to distance from the detector.]
Limitations of Vantage
Truncation, or the failure to keep the body in the field of view for all projections during attenuation correction, can cause serious artifacts to images. In patients with a particularly wide torso, this problem may not be avoided. Although most studies using attenuation correction improve specificity, especially for inferior wall perfusion defects, in some patients there is a problem of overcorrection of these attenuation artifacts. Overcorrection of attenuation artifacts is a common occurrence in patients with significant subdiaphragmatic tracer activity in contained in the liver, stomach or bowel. Clearance of the tracer from liver and bowel eliminates instances of overcorrection- in other words, offering the patient a few cups of cold water and waiting another 20 minutes prior to repeating the scan.
ANTERIOR/INFERIOR WALL CORRECTION ISSUES A common finding is an artificial increase in anterior wall activity accompanied by what appears to be a defect in the inferior wall. This type of artifact occurs when hot bowel is near the myocardium in the reconstructed transaxial slices. Wait for the liver to clear and bowel activity to move away from the heart, then repeat the scan. It is helpful to note that ice water and carbonated beverages help move bowel activity away from the heart in only a few minutes. Patients with vertically oriented hearts (usually very thin patients) are problematic due to perceived overlap of bowel and myocardial activity. In instances where there is gastric reflux of radioactive tracer from the small bowel, encourage the patient to eat a full meal. You may have to wait an hour or longer to wait for this activity to clear.
If attenuation correction fails to eliminate soft tissue artifacts, gated wall motion images may help differentiate healthy from ischemic or scarred myocardium.
Examples of Soft Tissue Attenuation in Cardiac SPECT
Male Patient 1 |
Male Patient 2 |
|
|
|
|
|
Diaphragm |
Diaphragm |
|
|
Displayed: Stress/STR-AC |
Displayed: Stress/STR-AC |
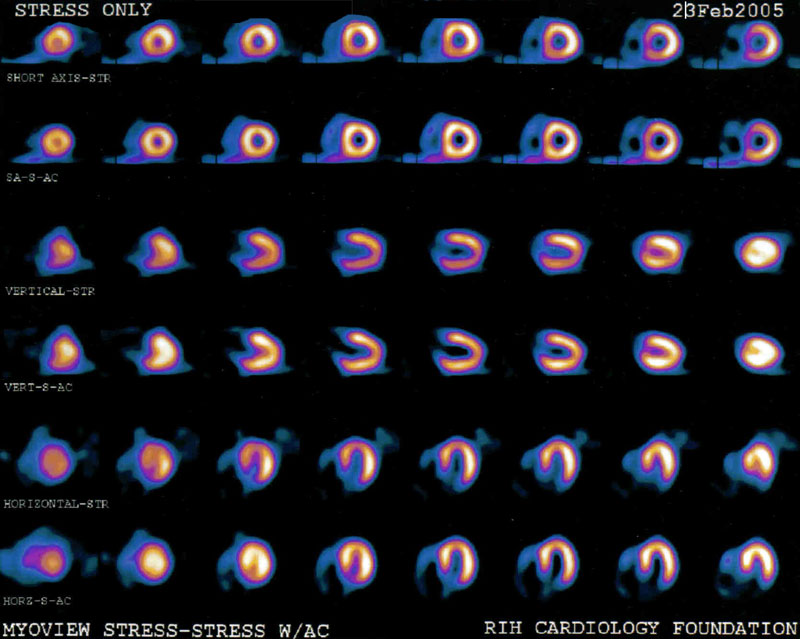
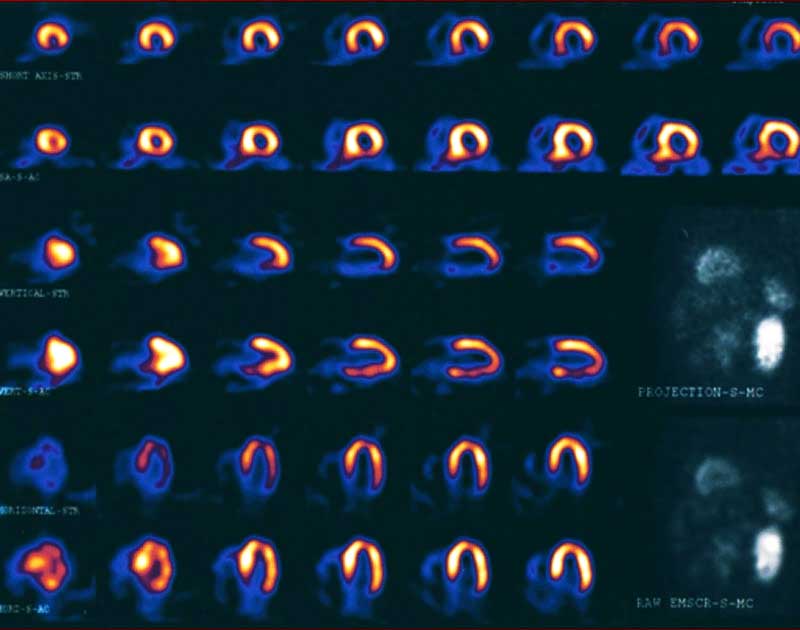
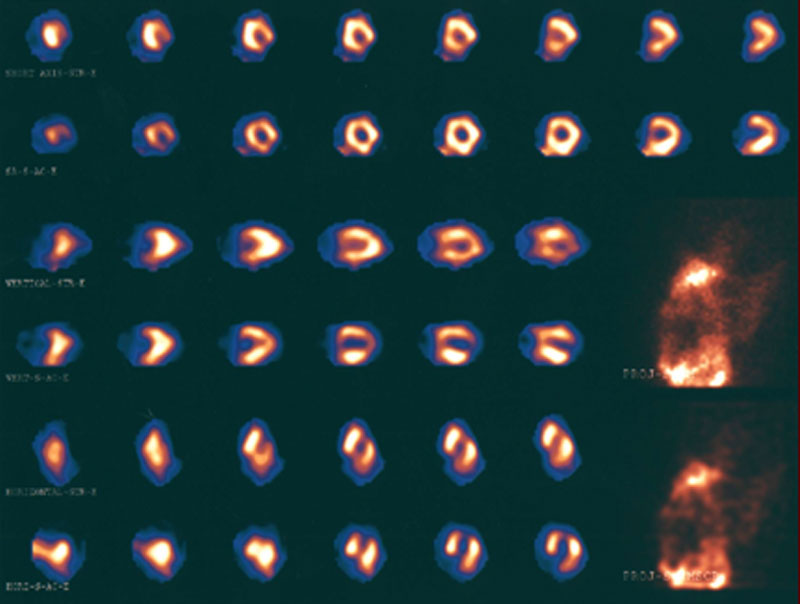
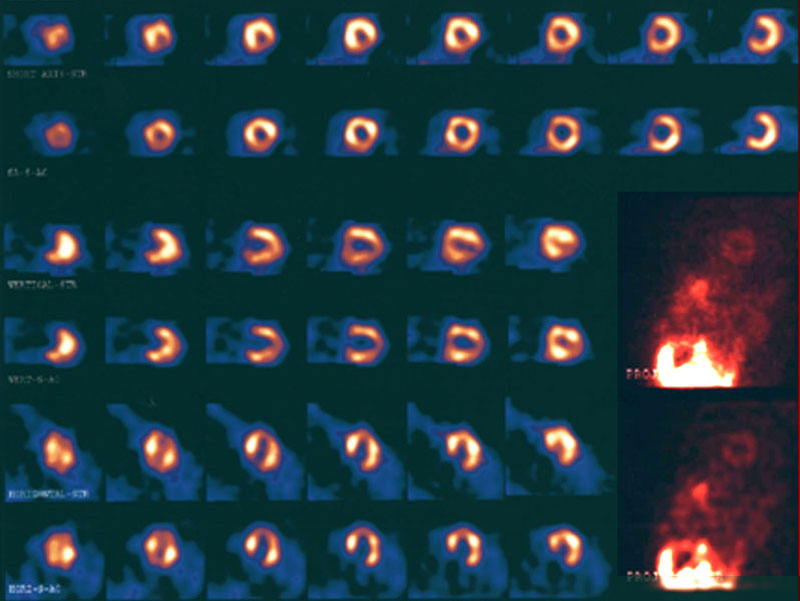
In the first two slides, Male Patients 1 and 2, stress/stress AC images clearly show correction for attenuation in the inferior wall in male patients. The third and fourth images compare the use of a broad velcro strap used like a corset to compress breast tissue in a very obese female patient who was not wearing a bra. Count density was very low in the lateral wall, due to overlying breast. Compare the quality of the raw projection images.
Morbidly Obese Female, image 1:without breast compression |
Morbidly Obese Female, image 2:with breast compression |
|
|
|
|
|
Stress/STR-AC Vantage:No breast compression |
Stress/STR-AC Vantage:Repeated with breast compression |
|
|
Note: Misshapen LV contours |
LV contours corrected |
The two images of the same female patient compare a high degree of breast attenuation artifact to simple breast compression with a broad velcro strap used like a corset. This very obese female patient was not wearing a bra. Count density was very low in the lateral wall, due to overlying breast. Compare the quality of the raw projection images.
GATED SPECT VS ATTENUATION
It is well recognized that nonhomogeneous attenuation from various organ tissues within the thorax can affect the specificity of SPECT myocardial perfusion imaging. Most physicians rely on visual interpretation and quantitative analyses to interpret these studies. They learn to integrate, in their final data analysis, the effects on the perfusion patterns of the presence of different physical factors such as variable spatial resolution of collimated SPECT systems and nonhomogeneous attenuation.
Soft tissue attenuation can create significant artifacts. Overyling breast tissue contributes to an anterior wall perfusion defect in women and men, while diaphragm creates an inferior wall defect in many male patients. Gating allows the physician to evaluate LV wall motion to determine whether the defect is real. Healthy myocardial tissue contracts well and thickens when it contracts. Wall motion in ischemic regions is slightly diminished, and scarred tissue does not contract normally.
EXTRACARDIAC ACTIVITY
When high levels of hepatic uptake or subdiaphragmatic activity of perfusion tracers are evident, lower-than-expected counts values may be recognized in the adjacent inferior myocardial wall. This phenomenon was studied in simulations and found to be the result of photon attenuation effects during reconstruction, distorting liver reconstruction and influencing inferior wall activity.
Although attenuation correction with Gd-153 transmission scans adequately eliminates breast and diaphragm artifacts, the presence of subdiaphragmatic radioactivity, especially when it is brighter than the heart, can cause uneven application of counts to the slices.
Hot Bowel Effect |
|||
|
|
|||
Initial/Post Clearance |
|||
|
|
|
|
|

Liver activity clears with time. Offer the patient a small meal to stimulate emptying. A bright bowel loop may be cleared very quickly after drinking a large glass of water or a carbonated beverage. Carbonation rinses the tracer from the lining the small bowel loop, and drinking ice water can help stimulate peristalsis. Occasionally, we see radioactive bile refluxing up into the stomach, which generally worsens over time. When possible, ask the patient to eat a full meal and image an hour or more later.
Some proton-pump inhibitor medications prescribed for acid reflux disease or gastric ulcer may be absorbed by the lining of the stomach. An outline of the stomach will be evident on the raw projection image, and slices through this area clearly show the cavity of the stomach. This activity is trapped by the organ and, unfortunately, does not move.