Indicators of Cardiac Function
Using safe, simple radionuclide techniques and sensitive detection equipment, we may calculate such indicators of function as cardiac output, cardiac index, mean pulmonary transit times, ejection fractions, and ventricular volumes. For many years we have been able to quantify left and right ventricular ejection fractions and ventricular volumes with simple techniques such as the gated radionuclide ventriculogram (MUGA) and gated SPECT myocardial imaging procedures. All four values may be obtained in minutes, though, with a radionuclide first pass exam. The precordial transit of radioactive blood can be tracked through the various cardiac chambers using highly efficient counting devices interfaced with a computer. This is a simple yet effective method for determining the presence of shunting, when there may be abnormal communication between chambers or vessels in the cardiovascular system.
DETERMINATION OF CARDIAC OUTPUT
Cardiac output can be defined as the effective volume of blood expelled by either ventricle per unit of time. It is usually expressed as milliliters or liters per minute. The output of either ventricle per beat is called the stroke volume. Expressed in terms of the stroke volume, the cardiac output (“CO”) would be equal to the stroke volume multiplied by the heart rate (“HR”).
CO (ml/ min) = SV (ml) x HR (beats/ min)
Cardiac output may be evaluated with radionuclide acquisition techniques. In normal individuals, the cardiac output averages 6.12 + 0.73 L/min with a range of 4.93 to 7.25 L/min. A more accurate indicator of output is the
cardiac index, and takes into consideration the body mass of the patient, expressed in square meters. The patient’s height and weight values are input in the patient data information fields by the technologist prior to acquisition.
The cardiac index (cardiac output per square meter surface area) ranges from 2.75 to 4.10 L/min/m², with a mean of 3.36 + 0.35 L/min/m². The stroke volume or cardiac output per beat averages 92 + 14 ml/beat; the range is from 70 to 120 ml/beat. The stroke index, which represents the stroke volume/m², amounts to 50 + 7 ml/beat/m².
CIRCULATION TIME and SHUNTING
Circulation time represents the shortest interval between the intravascular injection of a substance and its arrival at some distant site in sufficient concentration to produce a recognizable end point. Radionuclides produce a sharp, well-defined end point that is identifiable objectively by specialized sensitive equipment. Measurement of circulation times is used as an aid to proper diagnosis of cardiovascular disorders and to determine the velocity of blood flow.
Estimation of the mean pulmonary transit time is an objective means of assessing the impairment of the pulmonary circulation caused by left-sided heart disease. This value may also be obtained with a first pass, in which a histogram is created based on a region of interest defined in the left lung field. Intracardiac shunts and anatomic abnormalities can also be easily assessed with this noninvasive technique.
LEFT VENTRICULAR EJECTION FRACTION
The ejection fraction is the best estimator of the overall pump function of the heart. Using safe, simple radionuclide techniques and sensitive detection equipment, we may calculate such indicators of function as cardiac output, cardiac index, mean pulmonary transit times, ejection fractions, and ventricular volumes. The precordial transit of radioactive blood can be tracked through the various cardiac chambers using highly efficient counting devices interfaced with a computer.
INDICATORS OF FUNCTION: CALCULATING VENTRICULAR VOLUMES, STROKE VOLUMES, CARDIAC OUTPUT AND CARDIAC INDEX MANUALLY WITH THE ROUTINE MUGA SCAN
Where does the functional information derive from when a MUGA is processed? If your software doesn’t give you a complete set of results, a skilled technologist with a hand-held calculator can run all the data manually using the following formulas. For the inquisitive tech who would like to broaden their understanding of how things really work, I have transcribed my old manual MUGA processing notes from the 1980’s when our El Scint computer had less than spectacular processing software.
Worksheet:
A. Patient and Acquisition Data
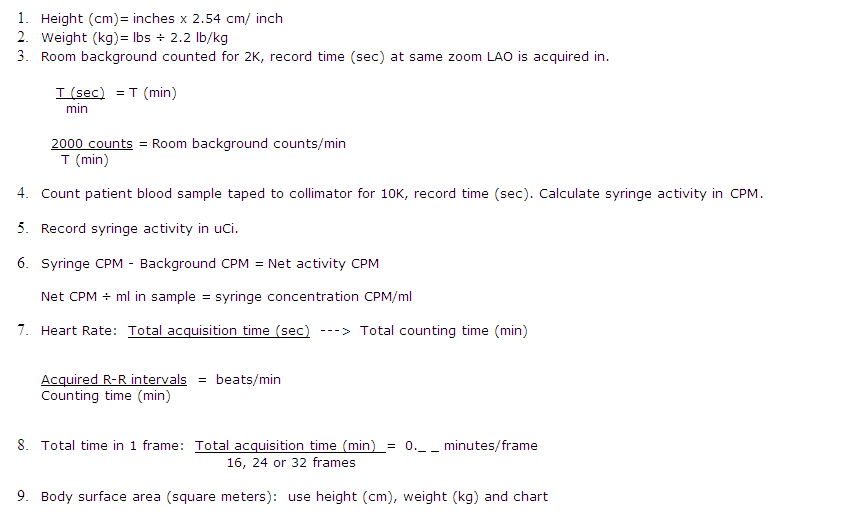 |
B. LEFT VENTRICLE
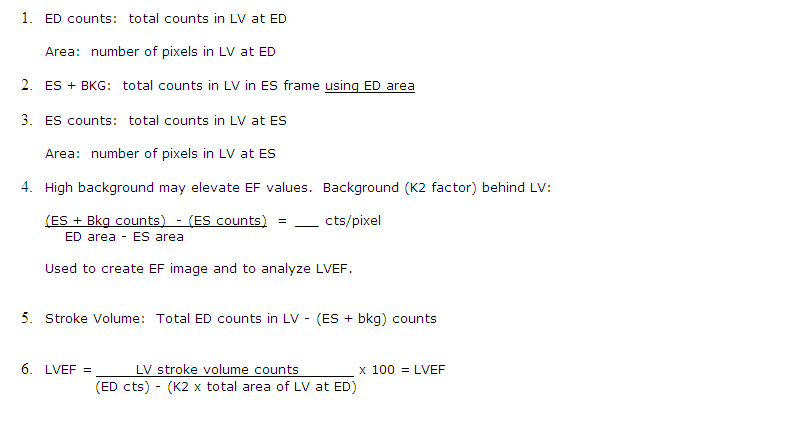 |
C. RIGHT VENTRICLE
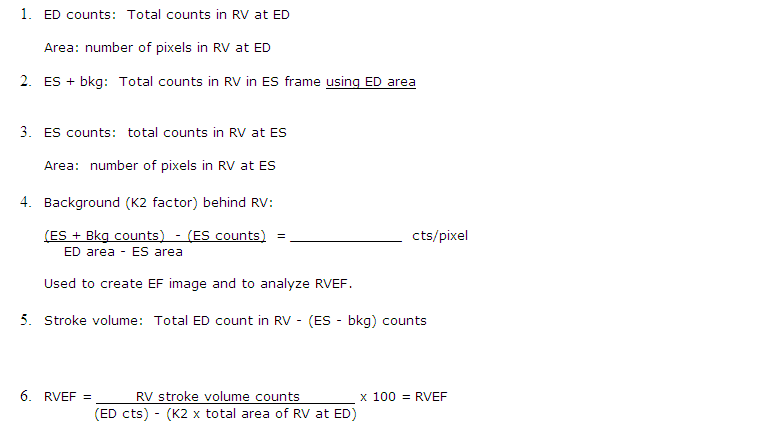 |
D. CALCULATIONS FOR LV
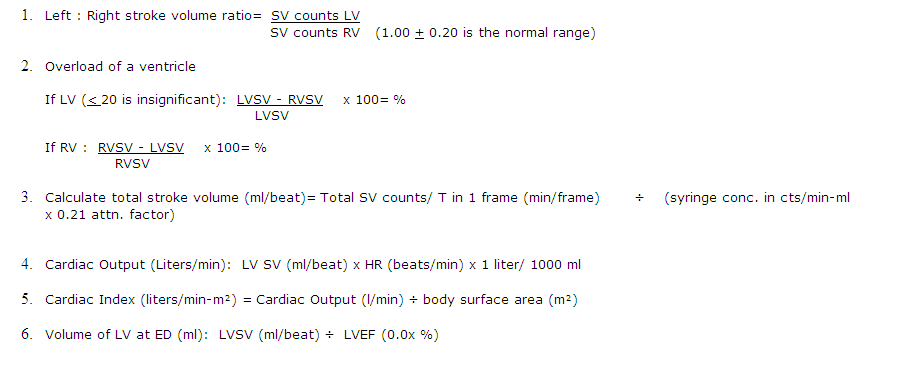 |
E. CALCULATIONS FOR RV
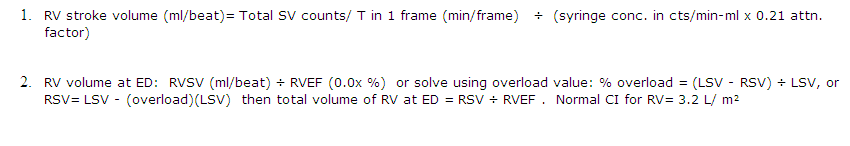 |
Calculations:
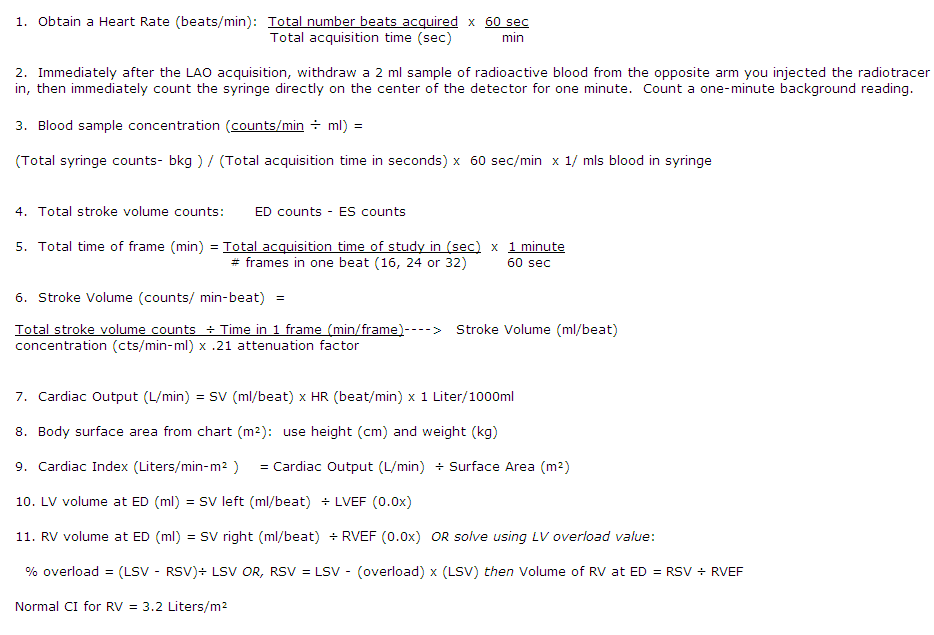 |