Cardiac Blood Pool Imaging
The Planar MUGA Scan
Gated Cardiac Blood Pool exams have a variety of names, including the “MUGA” multigated acquisition,”ERNA” equilibrium radionuclide angiography,”RNV” and “RVG” radionuclide ventriculography. Until the advent of gated myocardial SPECT, physicians relied on the MUGA scan to get valuable ventricular function data on patients with any number of heart conditions. Routine MUGA scans would be ordered for any of the following reasons:
- Acute myocardial infarction: wall motion abnormality in region of infarct with decreased regional wall motion and lower global ejection fraction. Patients with inferior infarctions can be expected to have RV wall motion abnormalities. Over 75% of patients with acute MIs have abnormal EFs.
- Coronary artery disease: many patients with CAD have normal function at rest, and exercise-induced ischemia can be detected with an exercise MUGA. Development of a new wall motion abnormality not present at rest.
- Evaluation following coronary bypass graft surgery (CABG): expect to see wall motion improvement after surgery
- Valvular heart disease: Response to pressure overload is concentric hypertrophy. Response to volume overload may be CHF.
- Cardiomyopathy: myocarditis
- Assessment of drug therapy
- Pulmonary disease: Pulmonary hypertension causes enlargement of RV and decreased functional capacity
- Doxorubicin Cardiotoxicity: Oncologists monitor the damaging effects of Doxorubicin (Adriamycin) Chemotherapy on heart muscle function. The drug causes loss of elasticity in cardiac muscle tissue with resultant permanent decrease in ejection fraction.
For the MUGA scan, we visualize the atria and ventricles over hundreds of cycles in a continuous ciné loop. The radiotracer of choice is Technetium 99m- autologous red blood cells, labeled in-vivo, in-vitro, or a combination of the two.
Statistically, counting data over hundreds of cardiac cycles in multiple views usually affords us a more accurate assessment of cardiac function than a single-pass of a radioactive bolus. These data are then summed for discrete intervals of each cycle- to give an average, representative picture of the patient’s cardiac function.
GATED BLOOD POOL Imaging is a dynamic computer acquisition and electrophysiologic gating to the heartbeat of the patient. We obtain a series of images over several hundred beats displayed as a continuous cine loop. Using a standard Anger scintillation camera and a gating mechanism interfaced to its computer, we can examine the phases of diastole in addition to calculating the global ejection fraction from changes in counts from ED to ES. Multiple views are acquired, generally a 45 LAO, Anterior, and 70 LAO or Lateral, so that the surface area of the left ventricular wall may be assessed.
The left ventricular ejection fraction is the most frequently calculated quantitative parameter of function. With the MUGA it is possible to quantify many functional parameters, including:
- Regional and global wall motion;
- Left and right ventricular end-diastolic and end-systolic ventricular
volumes and ejection fractions; - Stroke volume;
- Cardiac output;
- Regurgitant fraction for assessing “leaky” mitral or aortic valves (stroke index ratio);
- Peak and average ventricular filling and emptying rates;
- Cardiac shunt quantitation.
MULTIGATED BLOOD POOL IMAGING TECHNIQUE
The gated equilibrium study differs from the first pass technique in that data are collected continuously over hundreds of cardiac cycles. These data are then summed for discrete intervals of each cycle- to give an average, representative picture of the patient’s cardiac function. The gated technique is usually more statistically accurate than first pass data.
The gated blood-pool or equilibrium technique is sometimes referred to as a radionuclide ventriculogram because it examines the function of the ventricle, most commonly the left. The gated blood pool imaging technique requires labeling red blood cells with technetium and computer acquisition of a series of images gated to the R wave of the cardiac cycle. Application of computer technology to these “cardiac blood pool” studies permits collection and display of images in real time.
Physiologic “gating” devices allow precise registration and superimposition of sequential cardiac images. Unlike the first-pass method, the equilibrium approach requires administration of radionuclide in a form that resides continually within the intravascular space during the time that images are collected, with relatively little extravascular leakage. Although several binders can increase the intravascular residence of the isotope, direct binding of 99mTc to red blood cells is the preferred approach. Images acquired after the radionuclide reaches equilibrium within the intravascular compartment enables creation of composite images in multiple views. High resolution collimation used with the multigated technique provides enhanced temporal resolution and quantitative precision.
Radionuclide angiography has been applied extensively in all areas of cardiac disease, including diagnosis of coronary artery disease and cardiomyopathy, and for prognosticating, making management decisions, and evaluating therapy in patients with coronary artery disease, valvular heart disease, and heart failure of diverse etiologies. With a nonimaging modification of the equilibrium approach, it also has become possible to monitor LV function over several hours under various physiologic states and activities using a portable crystal device (THE NUCLEAR CARDIAC PROBE**). Important technical limitations remain, including the relatively restricted spatial resolution of standard Anger cameras, precluding precise evaluation of regional LV abnormalities, and overlap of atria and ventricles during equilibrium studies, even in the standard left anterior oblique view, limiting precision in measuring LV and RV volumes.
SPECT technology has been applied to blood pool imaging to overcome these problems, providing some obvious advantages over planar imaging. One major advantage to performing a SPECT MUGA is to assess right ventricular function in patients with congenital abnormalities, patients with heart failure, or patients for whom anesthesia might pose a risk. However, these advantages have not yet been sufficient to justify replacing the less expensive, less time-consuming, and less complex planar approach.
The following illustration divides the R-R interval (the cardiac cycle from ED to ED) into 16 equal segments. Frames 1 through 16 represent the corresponding ventricular volumes through the cycle.
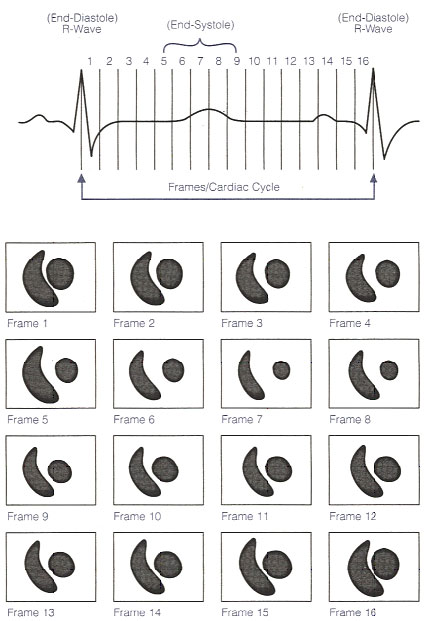
The gating mechanism and serial imaging in the LAO projection. Illustration obtained from Introduction to Nuclear Cardiology, Third Edition, 1993, DuPont Pharma.
Radiopharmaceutical selection: Technetium-99m labeled red blood cell
Gated equilibrium studies require a radiopharmaceutical that remains within the vascular space for the duration of the study. The first agent used as a blood pool tracer was 99mTc human serum albumin (1964), but was found to be less than ideal. By the 1970s, in-vitro (1973) and in-vivo (1977) methods of red cell labeling were established. The labeling procedure is based on the observation that the reduced technetium ion cannot move in or out of the red cell, while pertechnetate can diffuse freely in and out of the red cell.
Technetium-99m labeled red cells maintain a higher concentration in the vascular space. Technetium-99m labeled red cells are prepared by reducing the pertechnetate ion inside the cell with a reducing agent such as stannous ion, already present in the cell.
A variety of red blood cells labeling techniques may be used, but the most efficient tagging techniques are preferred. Optimal labeling is >95% binding efficiency- a high target-to-background ratio is important to reduce the tracer detected outside the vascular space.
RED BLOOD CELL LABELING TECHNIQUES
99m Technetium pertechnetate is bound to red blood cells using a variety of techniques. Three methods include the In Vivo Method, the Modified In Vivo/ In Vitro Method, and the In Vitro Method.
IN VIVO LABELING METHOD
- (Labeling efficiency approx. 90%)
- Step 1. Remove a vial of Sn-Pyrophosphate from the refrigerator, warm
it gently in your hands until it is room temperature. Reconstitute: inject 3 ml preservative free normal saline into a vial of Pyrophosphate without introducing any air into the reaction vial. Swirl gently for a few seconds until thoroughly mixed and let it stand a few minutes to equilibrate. The contents of the vial should be clear. Carefully withdraw 1.5 ml of reconstituted Sn-Pyrophosphate into a 3 cc syringe using aseptic technique. - Step 2. Inject stannous pyrophosphate into a good vein, preferably antecubital.
- Step 3. Wait about 20 minutes, then inject (IV) 20-25 mCi 99m Tc-Sodium Pertechnetate into a good vein, preferably antecubital.
MODIFIED IN VIVO/ IN VITRO METHOD (Labeling efficiency approx. 95%)
- Step 1. Remove a vial of Sn-Pyrophosphate from the refrigerator, warm it gently in your hands until it is room temperature. Reconstitute: inject 3 ml preservative free normal saline into a vial of Pyrophosphate without introducing any air into the reaction vial. Swirl gently for a few seconds until thoroughly mixed and let it stand a few minutes to equilibrate. The contents of the vial should be clear. Carefully withdraw 1.5 ml of reconstituted Sn-Pyrophosphate into a 3 cc syringe using aseptic technique.
- Step 2. Inject stannous pyrophosphate into a good vein, preferably antecubital.
- Step 3. Prewash 10 cc syringe with ACD solution to prevent clotting. Withdraw (via venipuncture) 3-8 ml whole blood into this prewashed, shielded syringe containing 20-25 mCi 99m Tc-sodium pertechnetate. Gently mix, then wait for equilibration for 10 minutes at room temperature.
- Step 4. Reinject contents of syringe.
An example of In Vitro Method: UltraTag® RBC Technique (Labeling efficiency 98%)
- Step 1. Withdraw 1 to 3 ml of the patient’s blood and mix with the reaction vial containing the lyophilized material. (An anticoagulant, heparin or ACD (acid citrate dextrose), is recommended to prewash the syringe prior to blood collection.)
- Step 2. After allowing 5 minutes for the blood to react with the stannous ion, add Syringe I and Syringe II. Syringe I contains a solution of sodium hypochlorite whose purpose is to oxidize the extracellular tin prior to adding Sodium Pertechnetate. Syringe II contains ACD which is used to make available the remaining extracellular tin to the sodium hypochlorite.
- Step 3. Add 10 to 100 mCi of Sodium Pertechnetate Tc99m (maximum volume of 3 ml) to the reaction vial.
- Step 4. Allow 20 minutes for labeling, then inject 20 to 25 mCi of Tc99m-labeled red blood cells into the patient and begin imaging.
PATIENT PREPARATION
RESTING MUGA Following radiopharmaceutical administration, three ECG leads are placed on the patient in the right and left supraclavicular areas and the left intercostal space. More leads as previously described may be used if the patient exercises
during the gated acquisition. In the gated equilibrium technique, a physiological signal- the R wave on the ECG- initiates the data collection cycle. The leads are plugged into an electrophysiological triggering device (gating machine), which in turn is connected by coaxial cable into the back of the gamma camera.
It is important to review the baseline ECG tracing to ensure that the patient has a regular heart beat and that only a single QRS complex appears during each cardiac cycle. Since the data acquisition will be initiated at each R wave, the R wave should be the tallest positive wave in the cardiac cycle. Manipulation of the electrode placement may be necessary to attain a single positive R wave. Generally, moving the black and red electrodes closer together increases the height of the R wave in patients who may have low voltage tracings.
DATA ACQUISITION A standard or small FOV camera equipped with a high resolution parallel-hole collimator is used to perform gated studies. Using the R wave of the ECG to trigger data collection, hundreds of cardiac cycles are collected and stored in a computer. Depending on the computer software, the interval between R waves is divided into frames, most often 16. Typically each frame is acquired in a 64 x 64 matrix, 200K – 400K counts per frame are obtained for a total of about 3-6 million counts for the entire 16-frame study.
POSITIONING Images are acquired in the anterior, left lateral, and LAO views. The angle of the LAO projection is adjusted to obtain optimum separation of the left and right ventricle. Tilting the detector head caudally will help define the valve plane and separate the left ventricle from the left atrium. Each view may be acquired for a preset time or for a preset number of counts. The caudal tilt may not be possible if the patient needs extra pillows under the head, or during stress acquisitions.
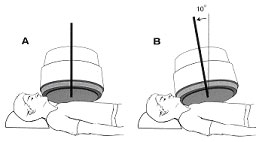
The patient is supine during resting MUGAs, but the patient may be seated propped at a 45 degree angle on a bicycle ergometer table. Standard views include Anterior, 45 Left Anterior Oblique, Left Lateral or 70 LAO, and sometimes Left Posterior Oblique. The patient may expect to lie close to the gamma camera for 10 minutes or more per view.
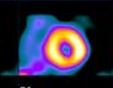
This is a screenshot of a standard three-view MUGA scan. Acquiring three views lets us evaluate all the walls of the left ventricle. The great vessels and chambers are depicted in the end-diastolic and end-systolic frames.
Images of the heart in systole and diastole are created by summing counts obtained during end-systole and end-diastole over many cardiac cycles. The cardiac cycle is subdivided into 16 or 32 frames. Each frame contains data accumulated from many heartbeats to create the multiple images of a composite beat. The acquisition is displayed in cinematic display format on the computer video display as a movie of a beating heart. Data acquisition from a gated cardiac study are most commonly evaluated by generating a time-activity curve of counts in the left ventricle. If the RR interval has been selected inappropriately, with too many R waves arriving early, image data do not fill the last images of the dynamic sequence equally; therefore counts in the last few frames can be artificially low, and volume curve can tail off at the end. Also, if too many beats have been obtained from inadequately acquired data, the cardiac ejection fraction value may be wrong. Atrial fibrillation may cause end-frame count dropoff, detectable by a simple ciné loop, with image fadeout toward the end frames. Delete the end frames from the raw data, then process.
 |
 |
The cell on the left is another variation on the illustration above. It correlates the progression of the cardiac cycle with ventricle size (volume) at each point in the cycle. The cell on the right is a time-volume curve. The MUGA report page shows the resultant ventricular volume curve so the physician may assess filling and emptying time.
EXERCISE MUGA
The objective of serial stress acquisition is to evaluate impaired function at increased exertion. This can indicate ischemic
response with a corresponding decrease in efficiency. Wall motion abnormalities may occur in the ischemic coronary territories, or the ventricle may temporarily increase in size at stress. A graded exercise program similar to that used for thallium stress testing is used, but for gated studies, a bicycle ergometer is most often employed to test the heart’s response to exercise. A baseline LAO view is obtained at rest. The patient is then guided through a graded exercise regimen in 3 minute stages, resistance on the pedals increasing with each advancement in stage. Post-exercise (recovery) images are obtained following completion of exercise.
Careful chest preparation will ensure optimal contact of the electrolyte gel with the patient’s skin in all ten electrodes while pedaling on the bicycle ergometer. The stress protocol begins and the patient is instructed to pedal smoothly at a consistent pace, with blood pressures and EKG tracings taken in each stage. The camera must be started at least 7 seconds prior to minute 2 to establish the average R-R interval and collects data for two minutes.
A conventional 12-lead setup may be used during an exercise gated acquisition. Place three additional electrodes on the patient’s skin for gating your stress acquisitions. The signal from the patient is sent from the electrocardiograph machine into the ‘trigger’ port in the rear of R-waves during the last two minutes of each stage is acquired as the patient exercises. A post exercise (recovery) view concludes the study.
Normal response to exercise: the LVEF should increase by 5% with continued normal regional wall motion. Many patients with CAD have no clinical manifestations and have normal ventricular function at rest. Exercise-induced myocardial ischemia can be detected with the MUGA scan. Myocardial ischemia is indicated with development of a new wall motion abnormality during exercise stress testing that was not present at rest, and failure of the EF to increase or even to decline in response to exercise.
**NON-IMAGING NUCLEAR PROBE
Although the first non-imaging nuclear probe for clinical application was already available
since the mid-1970’s, this technique is still underused for the assessment of ventricular function. Over the years substantial technological progress rendered nuclear probes more accurate and easier to use. Bedside devices can be used in the evaluation of hemodynamically unstable patients and of drug therapy. In patients with several heart diseases, particularly with ischemic cardiomyopathy, accurate information on the changes in ventricular function occurring during routine activities, as well as during structured activities, can be provided using the ambulatory probes. This review will focus on the development and clinical application of these diagnostic tools.
DOCUMENT DOWNLOAD: Pyrophosphate Package Insert
| page: |