Cardiac SPECT Imaging
STEPS TO SUCCESSFUL SPECT IMAGING
High quality diagnostic SPECT images result from a combination of camera selection, regular maintenance of hardware, adherence to QC guidelines, understanding the processing software, consistency in patient positioning, and obtaining the full cooperation of the patient during data acquisition. Hardware maintenance includes scheduled PMs of imaging equipment, yearly replacement of attenuation-correction sources, and replacement of faulty electro-physiological gating equipment, cables or lead wires.
Quality control includes daily isotope photopeak checking for all isotopes used each day, daily uniformity floods, daily attenuation-correction reference floods, and regularly scheduled COR checks. The recommended pixel size for myocardial perfusion SPECT is 64 + 0.4 mm for a 64 x 64 pixel image matrix.
Patient comfort– Patient cooperation is 90% of a successful study. Tailor your doses to the patient’s weight, select acquisition frame times that will yield the best count rate, and spend an extra minute getting the patient comfortable prior to starting the camera. Take the time to explain that talking, deep breathing, coughing, adjusting arm position, crossing and uncrossing the legs, twisting and stretching during imaging are going to yield less than optimal raw data. Motion artifacts put defects into the images that may not really be there, or make existing defects larger. The patient must understand that he can contribute to the quality of his exam, from his performance on the treadmill through the image acquisition.
A word about Claustrophobia– It happens to all of us. The patient completes his stress test, the technologist accompanies him to the imaging suite… then the patient sees the camera and all bets are off. The personality changes completely as irrational fears come to the fore. Your task is to get functional images on a reluctant customer, and you ought to explore PRONE gated imaging before scrubbing the test. The patient will experience a genuine sense of accomplishment, having trusted the good judgement and skill of his technologist. Empower your claustrophobic patient and offer Prone gated myocardial imaging!
Remember ‘cardiac creep’– It is recommended that SPECT imaging begin at least 15 minutes after high-level exercise to avoid the phenomenon of myocardial creep or upward creep, which was prevalent in stress Thallium imaging. This phenomenon will be discussed in the section of this lesson devoted to motion artifact.
Processing software– The technologist must be comfortable with processing SPECT studies. The technologist must evaluate the raw projection data for motion, missing or corrupted frames, inspect for overlying bowel and liver activity, decide when it would be appropriate to apply motion correction and when to reimage the patient.
Reconstruction filters and windows should meet the needs of the interpreting physician but still stay within the confines of realistic contrast and noise limits. Incorrect long-axis selection from the transaxial slice can cause shifts in apical counts. Apical thinning is a common finding, but incorrect image reorientation can shift this defect off-center, creating a perceived perfusion defect. Finally, the interpreting physician must understand that limitations exist in any imaging medium, and quantitation techniques are not absolute.
Acquisition Setup– After positioning the patient with the heart in the center of the field, the detectors are rotated through an acquisition orbit in an effort to bring the camera heads as close to the patient as possible without touching at the angle with the greatest body diameter. Devices which collect data in an elliptical orbit allows the detectors to remain closer to the body during rotation, enhancing resolution.
If data are collected in a 360-degree orbit, the patient should have both arms elevated and supported to alleviate fatigue and minimize movement. If a 180-degree orbit is chosen, only the left arm need be elevated, the right arm held in place at the side with a velcro strap or elastic chest binder. Data acquisition for the 180-degree orbit typically begins at 45 degrees RAO and ends at 45 degrees LPO.
Image acquisition time varies from 12 to 30 minutes, depending on several factors, whether a single or multiple detector camera is used; whether a 180-degree or 360-degree acquisition is performed; whether a 3 or 6 degree step angle is used; and the number of counts collected at each increment.
NEW TECHNOLOGY: CZT MULTICRYSTAL DETECTION SYSTEM
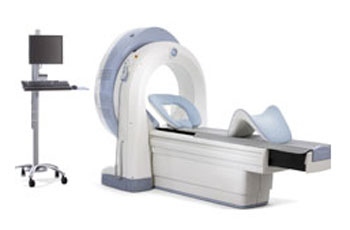 Introducing a small-footprint imaging system that makes cardiac imaging (and processing) fun. Finally, a brand-new technology has been introduced by GE that makes the 50-yr old Gamma Camera look like a dinosaur. To quote the GE webpage, “the Discovery NM 530c with Alcyone™ technology brings together innovative solutions with the potential to redefine the way in which physicians can study the heart.” In my opinion, the Xeleris workstation rivals the Philips Jetstream for ease of use for both the tech and the reading physician.
I became acquainted with this system in December 2009 at RIH, and this new technology has really slashed imaging times, eliminated the need for motion correction, and streamlined the hands-on data processing for the busy technologist. Alcyone Technology combines Cadmium Zinc Telluride (CZT) solid-state detectors, focused pin-hole collimation, 3D reconstruction, and stationary data acquisition. The “camera heads” resemble curved pads that are positioned flush to the patient’s chest. In three to five minutes, the scan is complete, with or without gating. Prone imaging is easily integrated into the routine and images are automatically displayed with supine Stress and Rest tomograms. Pre-processing and image reconstruction is performed on the fly, then data is transferred to the processing terminal for reorientation and 4D analysis.
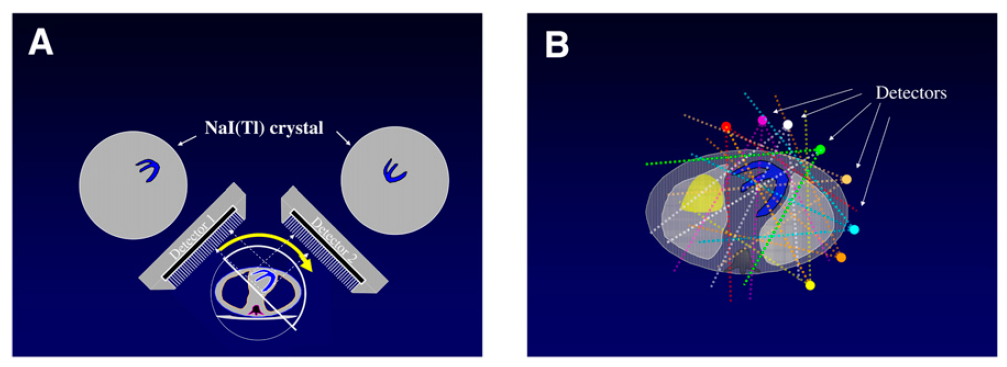
(A) Conventional NaI dual detectors vs (B) CZT Multi-crystal detection (image credit)
A wonderful feature of this technology is that the camera can apply the table/detector position from one scan to a new acquisition done at a later time on the same patient. The robot slides the gantry and imaging table into the same coordinates used on a prior scan. A second plus is that raw data reconstruction is applied on the fly before transferring it to the processing station. All you do as a technologist is reorient the stress, rest and prone images for display and archival.
In the 2010’s, the focus is on lowering the radiation dosages to patients (and staff). The new-generation dedicated cardiac ultrafast scanners, 8 detectors surrounding the patient simultaneously image the heart. There is a 5 – to 10 – fold increase in count sensitivity with no loss of, or even a gain, in resolution. We may reduce the average Myoview or Tetrofosmin resting injection to 9 mCi in patients up to 200 lbs without sacrificing image quality. Half-dose one-day exams scan in double the time (6 or 10 minutes) and they look great. The CZT systems allow us to move patients through one-day exams efficiently, even when prone imaging is routinely added to men and women patients. I figure an hour of imaging/processing time is saved per patient.
DRAWBACKS: This camera is not able to handle patients who are broad-chested, with wide torsos. It is not even a matter of obesity in some patients. Whether in the supine or prone position, if you are as close as humanly possible to the detection system yet are unable to center the myocardium, you are cutting out structures that need to be included for processing and image interpretation. Our physicians still find attenuation correction helpful in the obese patient population on our conventional dual-head gamma camera system.
SPECT PROCESSING
Each of the or 64 raw projections undergoes a series of processing steps
- Field correction for camera nonuniformity with a 100 million count Tc99m intrinsic uniformity flood
- Mechanical Center of Rotation, determined from the projection images, is applied to align detector data with the reconstruction matrix
- Philips ADAC Autospect Plus processing applies a Butterworth filter with a cutoff frequency of 0.5 cycles/pixel and an order of 5 (highest efficiency) to the images before reconstruction with either an Iterative or a Pegasys Filtered Back Projection technique. For low-dose/ high-dose studies, these values will have to be adjusted.
- 3-D axial data are reoriented in the short axis perpendicular to the long axis, as well as in vertical long-axis
- Tomograms are reconstructed at 1 pixel/slice, representing a thickness of ~ 6.2 mm
After the raw data has been acquired and saved to the hard drive, the first step the technologist must take is to review the entire raw projection image for evidence of motion, corrupt or missing frames, evidence of gating problems, attenuation artifact, and subdiaphragmatic bowel, liver, or stomach interference.
SPECT IMAGE RECONSTRUCTION
Filtering is the process of altering the spatial-frequency spectrum of an object. All standard nuclear medicine computer systems are equipped with a variety of frequency filters, and Fourier transformation software allows the user to alter the spatial frequency of planar and tomographic images. The most common are Butterworth filters, which have a critical (or cut-off) frequency and power. The filters used during this stage of processing are usually recommended by the gamma camera manufacturer. Filter selection is based on published literature for phantom and clinical evaluation performed to optimize sensitivity and specificity. Generally, each planar summed image is prefiltered in frequency space with a smoother frequency filter for relatively low-count images, and a sharper frequency filter for relatively high-count images.
Before the reconstruction process begins, the technologist defines the reconstruction boundaries in the SPECT acquisition image matrix. A set of boundary lines defining the data to be filtered are dragged by the technologist above and beneath the heart. Setting boundaries minimizes the amount of data processed and the storage space needed for the study. A reference line automatically appears between the limits set around the heart in the reconstruction step. This corresponds to the “reconstructed slice” preview window displayed beneath the filtered projection image at the bottom of the screen.
This preview shows us the effect of our preset filters on our data. At this point, the technologist must be mindful of whether the appropriate smoothing filters have been applied to render a high-quality data set. Adjusting the “cutoff” toward the higher numbers hardens the image, while using the lower numbers softens the image. Adjustments made to the “order” adjust the nature of the background. For image sets with low count rates, using a higher order may smooth the image in the reconstructed slice and deemphasize the background. For technologists using low-high imaging protocols, testing the frequency/ cutoff values are part of the processing routine. Click on the “Auto Reorient” button to go to the next step, image reorientation.
SHORT AXIS SLICES of the heart are made by slicing perpendicular to the long axis. Stress and rest images will be comparable if the selection of the long axis of the heart is consistent for the two studies. The long axis plane selection of the first study processed should be reviewed before processing the second study.
SPECT IMAGE REORIENTATION
The process of left ventricle reconstruction begins with the formation of transaxial images that are perpendicular to the long axis of the body. Transaxial images and sagittal images are made in the same way as other SPECT reconstructions. The heart sits at an oblique angle in the chest, so the transaxial images are cut through the heart at an oblique angle. Because the angle of the heart and myocardial thickness varies from person to person, we have modified the way we standardize cardiac image display and interpretation. The planes along which sectional views of the heart are made are the SHORT AXIS, HORIZONTAL LONG AXIS, and VERTICAL LONG AXIS.
Reorientation involves several steps. First, a transaxial slice through the midportion of the left ventricle that clearly shows the heart cavity is chosen by the technologist processing the study. The technologist manually draws the azimuth through the cavity parallel to the long axis of the ventricle in the “trasnverse” viewport. In the “sagittal” viewport, the definition of the long axis is repeated in the same way on a midsection sagittal slice, defining the elevation. In both cases, the axis drawn must intersect the apex and be parallel to the walls of the heart. The outer confines of the left ventricle walls are defined with cursor lines on both images.
If the angle of the heart appears to change as the technologist pages through the transaxial slices, a slice should be chosen that is the midpoint of the angular variations. The angle selection is a visual judgment with manual processing. Appropriate angle adjustment must be made to ensure that the reference line defining the long axis correctly intercepts the apex. Manual selection of the long axis of the left ventricle is subject to interobserver variability and is dependent on operator expertise and careful attention in choosing the angle. Incorrect plane selection will result in distorted reconstructed images and polar images.
This schematic represents the heart in the chest. SPECT data are reoriented to present the myocardium in views that are orthogonal to the major cardiac axes. The slices are called short axis views (cut from apex to base of the left ventricle), horizontal long axis views (cut from the posterior wall to the anterior wall of the left ventricle), and vertical long axis views (cut from the septum to the lateral wall).
Processed Data Display: the Row Tomogram
The Philips-Adac system displays the processed data in the following order: SHORT AXIS, VERTICAL LONG AXIS, HORIZONTAL LONG AXIS. The SHORT AXIS slices cut the left ventricular volume from Apex-to-Base. The VERTICAL LONG AXIS cuts from the Septum-to-Lateral Wall, and the HORIZONTAL LONG AXIS cuts from Inferior-to-Anterior wall.
Characteristic appearance in the normal heart
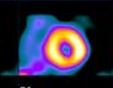
Myocardial perfusion transaxial tomography has a characteristic appearance in the normal heart. In the vertical-long axis and the horizontal-long axis slices, the left ventricle is horseshoe-shaped. The open end of the horseshoe corresponds anatomically to the aortic valve plane. The radiopharmaceutical distribution throughout the septum, anterior walls, inferior, and lateral walls of the left ventricle should appear homogeneous. The left ventricle appears doughnut-shaped in most images along the short axis plane with the central portion of the doughnut representing the left ventricular cavity. Slices through the apex show a round or oval region of activity with minimal or absent appearance of the cavity. The right ventricle may be faintly detected, and atria do not appear at all.
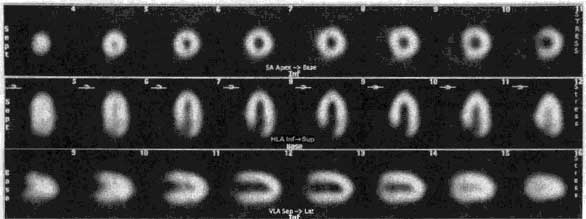
ROW 1: short axis ROW 2: horizontal long axis ROW 3: vertical long axis
In patients with myocardial infarction, regions of markedly reduced or absent perfusion are seen in areas corresponding to the location of the infarct. The extent of the perfusion defect is usually greater on emission tomography than on the standard two-dimensional scintigraphy. The border between the normally perfused myocardium and the perfusion defect is clearly defined on tomography, since perfused myocardium is not superimposed on the ischemic tissue as it is with planar imaging. Tomography improves and enhances the contrast between the myocardium and surrounding structures, such as the lungs and liver.
- 7a: Planar Imaging
- 7b: SPECT Imaging
- 7c: SPECT Anatomy
- 7d: Interpretation
- 7e: Attenuation Correction
- Lesson 7 REVIEW