MUGA Processing Methods
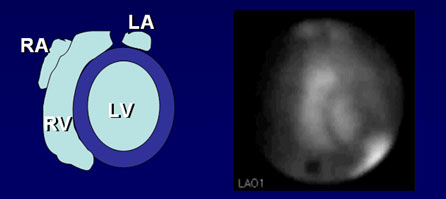
A patient’s LVEF and other quantitative information are obtained from the best separation left anterior oblique view. Quantitation begins with a determination of the net counts in the region of the ventricle for each frame in the study. Fully automatic and semiautomatic computer programs are available for edge detection. These programs work very well when there is a good target-to-background ratio. The target-to-background ratio is dependent on good positioning and red blood cell labeling efficiency. Computerized edge detection is considered to be more accurate than the manual processing method because it is based on a mathematical model, not on visual discrimination. Semiautomatic and automatic edge detection software uses threshold and second derivative methods for finding the edge of the ventricle in each frame.
With the Philips-Adac processing software, the user has the choice of selecting a fully AUTOMATIC, MANUAL ED/ES, or fully MANUAL methods of processing. With AUTOMATIC EDGE DETECTION, the first step draws a box around the LV in the first frame of the acquisition, then from the center of the ventricle, numerous radii are sent outward in all directions to search for the edge using the thresholding and second derivative methods.
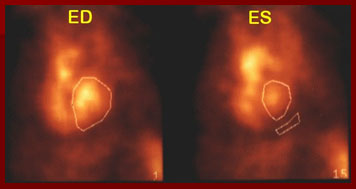
Using the MANUAL ED/ES processing method, the technologist manually draws a region around the ED frame, the ES frame, and creates a background region of interest. The user’s choice of the Background Region of Interest can artificially elevate the calculated EF, so take high and low areas of activity under careful consideration. The numbers used to calculate EF and generate the volume curve should be counts in each frame from the blood pool within the ventricle. For an accurate EF and volume curve, background activity must be subtracted from the total counts of each ventricle ROI. A contoured background region several pixels
wide should be drawn along the lateral side of the LV edge. It should be close to the heart without overlapping the ventricles, spleen, aorta, an aneurysm, or other blood pool structure. Counts originating from the blood pool must be subtracted from the total region counts. The frame below illustrates the end diastolic frame outlined in frame 1, the end systolic frame in frame 15, with a small region if interest beneath the LV for background subtraction.
The MANUAL ALL FRAMES processing method is an option provided by the software, but I do not recommend its use, as it is both labor and time intensive. This method is subjective, very dependent upon the visual determination of a border by the operator. The ROI generated for each frame of the cardiac cycle should include all of the left ventricle. The region should not include or overlap any other structures, namely the septal border of the right ventricle, great vessels, or atrium. The background region should appear in the same place on all frames, representing the average activity behind the LV.
REPORTING RESULTS Comprehensive analysis and interpretation of MUGA scans requires both qualitative and quantitative analysis. The data from all the cardiac cycles collected are added together to form a representative cardiac cycle. The composite cycle is displayed as a continuous loop, sometimes referred to as a “cine” image, which simulates the beating heart. This display of the beating heart is useful in visualizing regional wall motion abnormalities such as akinesis, dyskinesis, and hypokinesis. Left ventricular aneurysms, dilatations of a portion of the ventricular wall, reveal an outward bulge during systole (dyskinesis).

EJECTION FRACTION is the most frequently calculated quantitative parameter of left ventricular function. The left ventricular ejection fraction (LVEF) is a sensitive indicator of left ventricular function.
Ejection fraction (%) = [ED (net) – ES (net)] ÷ ED x 100
This is defined as the fraction of the left ventricular end-diastolic volume expelled during contraction. The principle underlying calculation is that the net left ventricular count rate at each point in the cardiac cycle is proportional to the ventricular volume. Net counts are determined by drawing a region of interest over the LV for each frame of the cardiac cycle and a background region, typically taken as a crescent adjacent to the apex (should not overlap activity in spleen or aorta). A background-corrected time-activity curve is then generated.
Counts detected in the LV are proportional to volume, and the change from end-systolic counts (ESC) to end-diastolic counts (EDC) of the LV can be used for the calculation of left ventricular ejection fraction. The normal range for the left ventricle is 50-75%, the right side is about 45%.
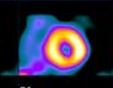
PHASE AND AMPLITUDE The illustration shows the concept of phase and amplitude. Each pixel has its own characteristic variation and count rate through the cardiac cycle and its own characteristic
timing of the peaks and valleys of the amplitude change.
Fourier phase analysis reduces four-dimensional data into a pair of two-dimensional images. The images created depict contractility (amplitude) and contraction sequence (phase). The amplitude image portrays the maximum net count
variation for each pixel during the cardiac cycle. The phase image portrays the relative time delay from the R wave to the start of the cardiac cycle for that individual pixel.
Wall motion abnormalities are portrayed on phase images as low-amplitude areas. Regions of paradoxical motion due to aneurysms, for example, are 180 degrees “out of phase” normally.
Abnormal conduction patterns like those seen in bundle-branch-block cause affected areas to be slightly out of phase with adjacent portions of the ventricle owing to premature
or delayed contraction.
In the paradox image the end-diastolic frame is subtracted from the end-systolic frame. In normal ventricular function, this leaves a void. In ventricles showing areas of paradoxical ventricular wall motion, the systolic
bulge is readily detected as an area of unsubtracted activity.
A complete analysis and interpretation of the MUGA includes a qualitative visual assessment of the cardiac chambers and great vessels to assess their size and relationships and quantitative regional wall motion analysis.
Quantitative analysis includes:
- calculation of left ventricular ejection fraction
- left and right ventricular stroke volume ratios,
- cardiac output
- ventricular volumes
- rates of ventricular filling and emptying
VOLUMETRIC CURVES Here we show the relationship between the movie images, time versus volume curve, and ECG. Multiple functions are subserved by the data set collected during real-time equilibrium radionuclide cineangiography. Each photon is given three addresses in computer memory one locating the photon in space, one identifying the time in which the photon was detected, and one indicating the duration of the cardiac cycle during which the photon was collected. In addition, the computer also stores the time of the last gating signal. This allows for precise superimposition of segments of data collected during intervals timed similarly after the gating signal in successive cardiac cycles, yielding production of an endless ciné loop movie display of the composite cardiac cycle.
The picture file in an equilibrium radionuclide cineangiogram is created by digital superimposition of image data that are in perfect temporal registration with reference to the ECG gating signal preceding each imaged cardiac cycle.
MUGA ANALYSIS REPORTS PAGE
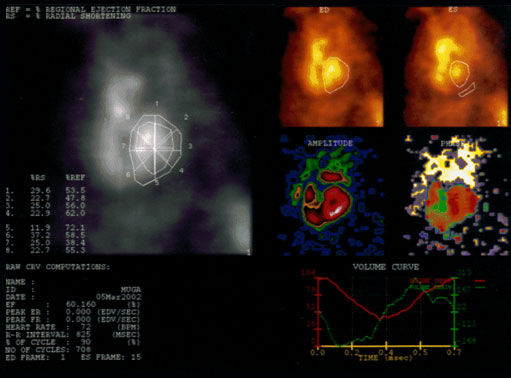
The report of this MUGA scan shows us global and regional ejection fractions, the frames chosen to represent the ED and ES portions of the cardiac cycle, the size, shape and location of the background region of interest, and the volume and derivative curves. The regional and global left or right ventricular ejection fractions may be obtained, phase and amplitude (subtraction) images and stroke volume ratios give an important picture of cardiac function.
MUGA ANALYSIS REPORTS PAGE detail
It might be helpful at this point to see an example of a MUGA report for an exam that had been reported as within normal limits. This is old ADAC software that has been around for decades for planar multigated acquisitions, and is still in use today in many institutions.
The report of this MUGA scan shows us global and regional ejection fractions, the frames chosen to represent the ED and ES portions of the cardiac cycle, the size, shape and location of the background region of interest, and the volume curves. The heart rate, the duration of the R-R interval in milliseconds, the number of cycles counted, and the left ventricular ejection fraction of 60% is in the report.
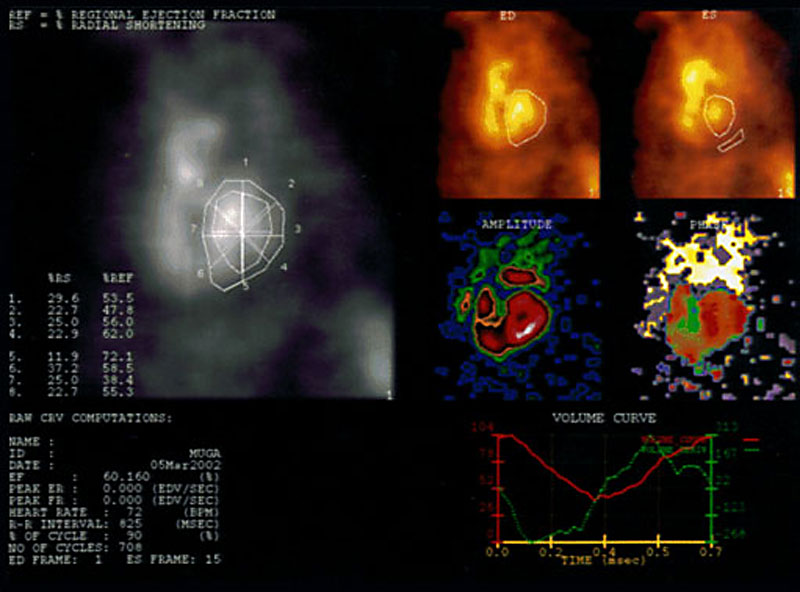
The upper left viewport displays the percent regional ejection fraction, percent of radial shortening, and regional ejection fractions and radial shortenings corresponding to points on the region of interest. The regional ejection fraction and radial shortening values are calculated for each region of interest by the Gated Analysis Application. Each region is divided into eight pie-shaped ROIs by eight line segments that originate from the geometric center of each ROI. These segments are generated at 45 degree intervals. The change in the length of the radial line segments determines the radial shortening, and the change in counts of each pie-shaped region determine the regional ejection fractions.
Beneath this viewport, patient information, ejection fraction, heart rate, R-R interval in milliseconds, number of cardiac cycles the data has collected, and the end-diastolic and end-systolic frame numbers.
Moving to the right upper quadrant, the ED and ES viewports display the end diastole and end systole images with corresponding ROIs and the background ROI drawn by the user, respectively.
The amplitude and phase images provide information on ventricular motion. Fourier phase analysis reduces four-dimensional data into a pair of two-dimensional images. The images created depict contractility (amplitude) and contraction sequence (phase).
Wall motion abnormalities are portrayed on phase images as low-amplitude areas. Regions of paradoxical motion due to aneurysms, for example, are 180 degrees “out of phase” normally. Abnormal conduction patterns like those seen in bundle-branch-block cause affected areas to be slightly out of phase with adjacent portions of the ventricle owing to premature or delayed contraction.
In the paradox image the end-diastolic frame is subtracted from the end-systolic frame. In normal ventricular function, this leaves a void. In ventricles showing areas of paradoxical ventricular wall motion, the systolic bulge is readily detected as an area of unsubtracted activity.
volume curve detail
The volume curves shown on the right bottom viewport can tell the interpreting physician at a glance whether the ventricle is filling and emptying efficiently.
The red line is a time-activity curve where the vertical axis represents the percentage of blood remaining in the ventricle, while the horizontal axis shows the time in milliseconds. The red line shows the interpreting physician that the ejection fraction and wall motion are normal, and the left ventricle refills with blood in the post-systolic portion of the histogram within normal limits. The green is the volume derivative time-activity
curve.
| page: |